Dimensions Reporting
Income Summary
Examine net sales, sales tax, gross sales, discounts, promotions and performance totals.
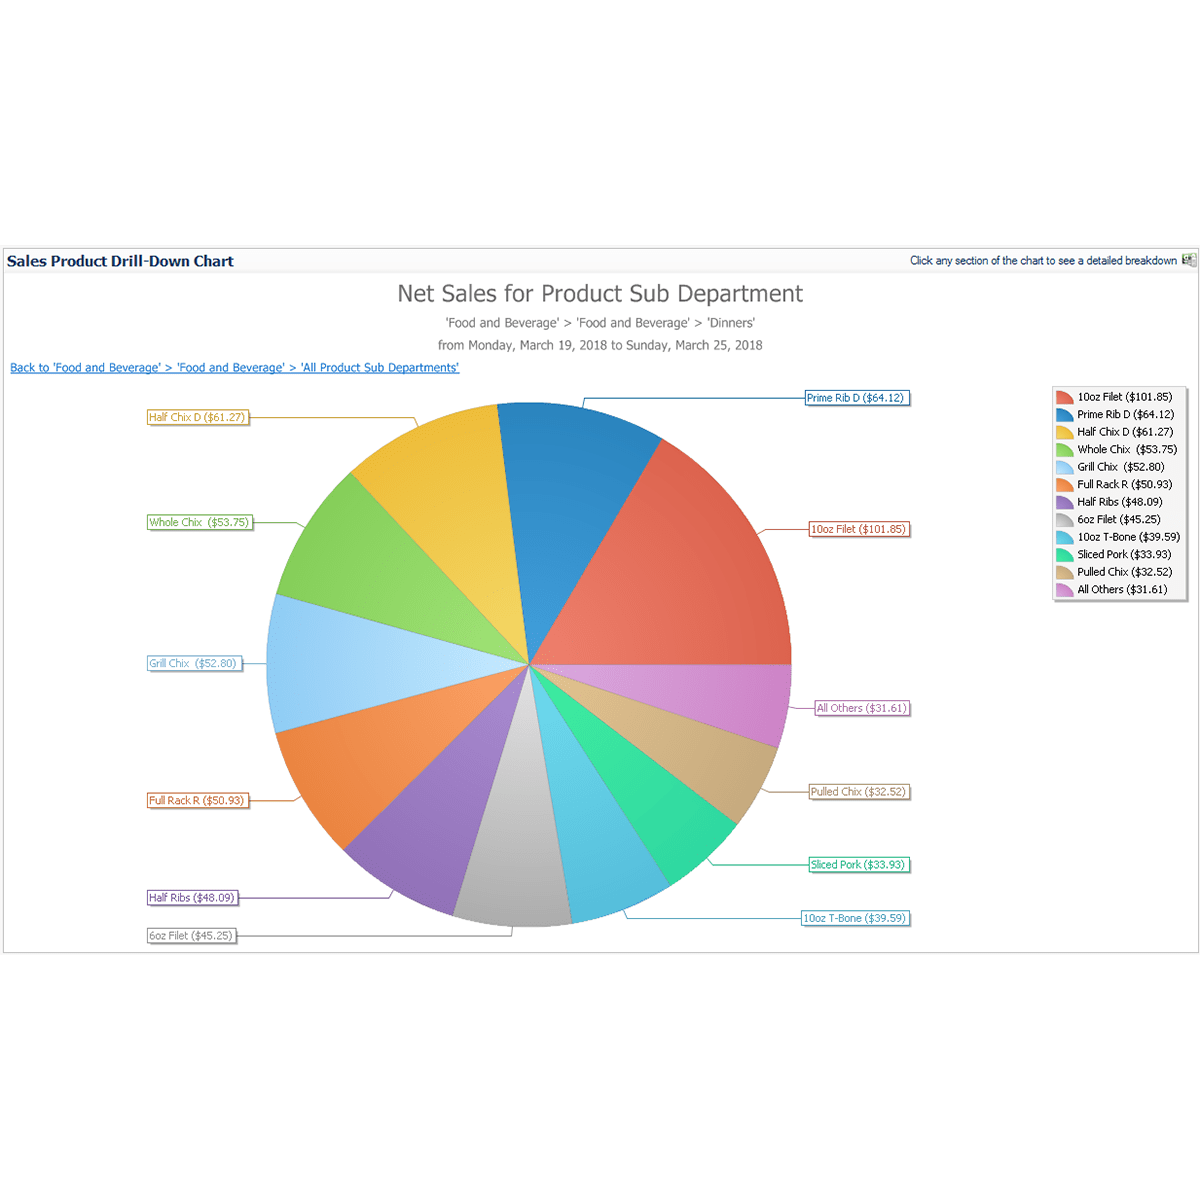
Sales Product Drill Down
Graphical view of product sales by category with drill down functionality to product level.
Audit Transaction Report
Report showing a complete detail of all transactions with receipt lookup functionality.
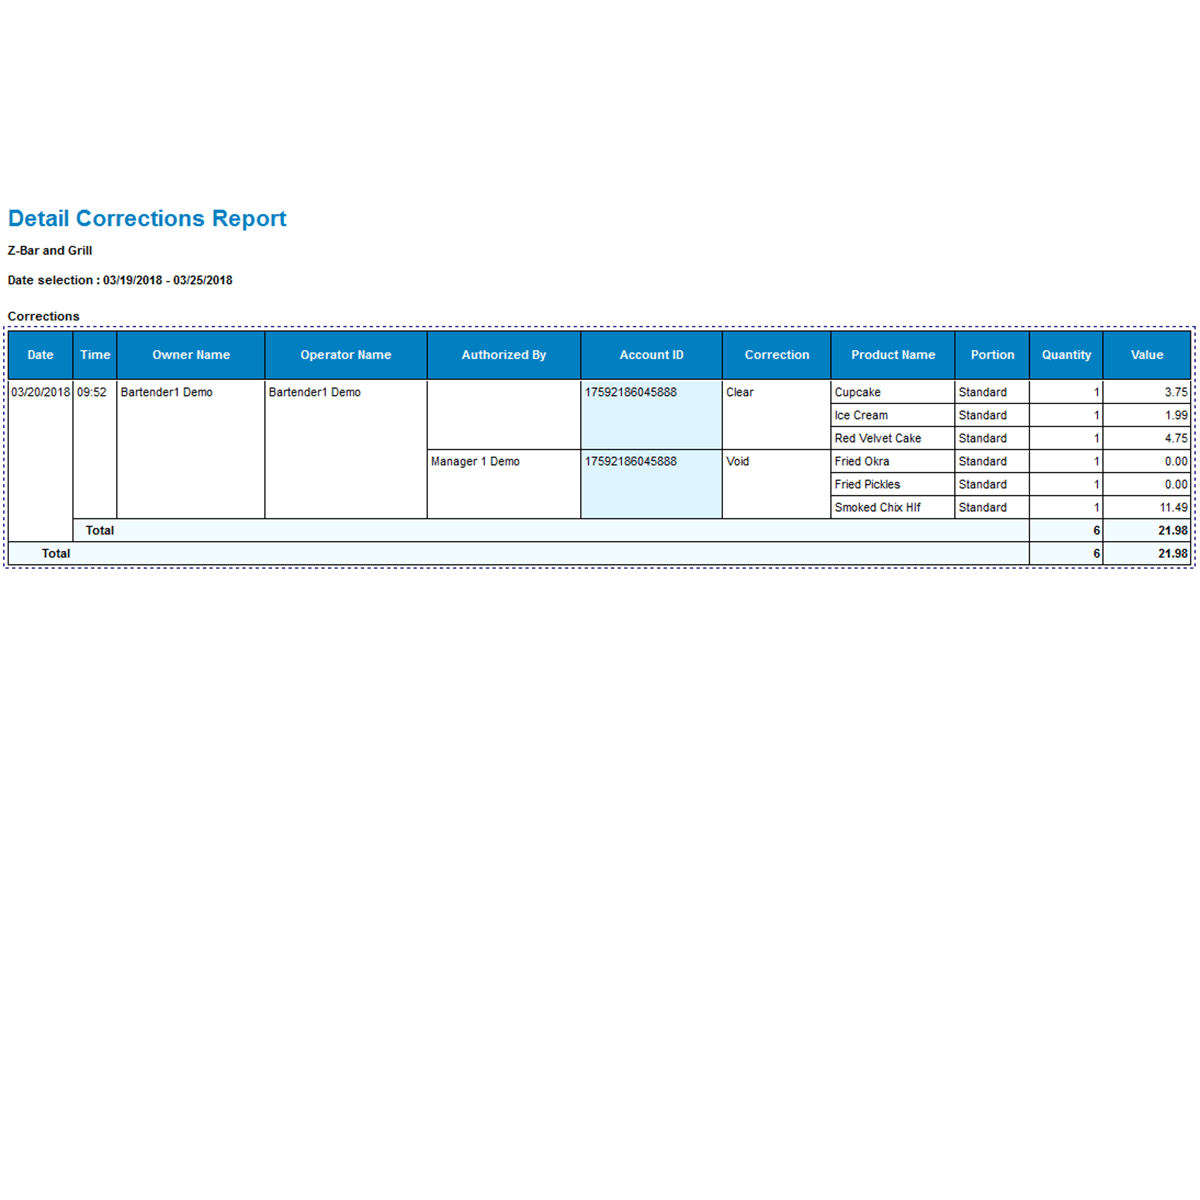
Detailed Corrections Report
View all corrections made including authorization information, correction type and corrected products with receipt lookup functionality.
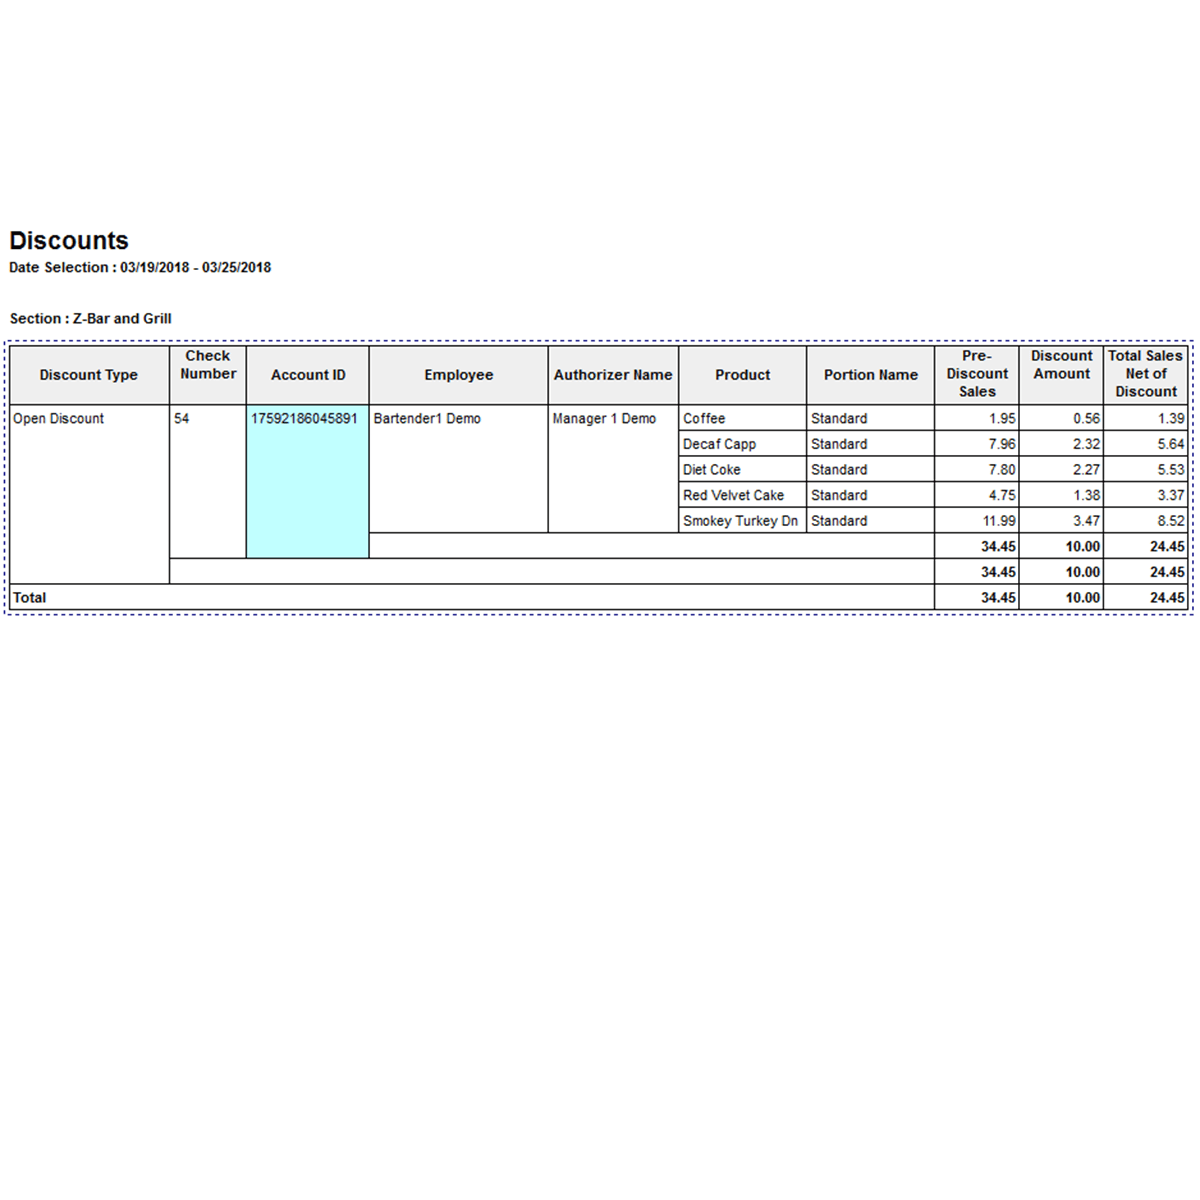
Discounts Report
Overview of all discounts made including authorization information, discount name and discounted products with receipt lookup functionality.
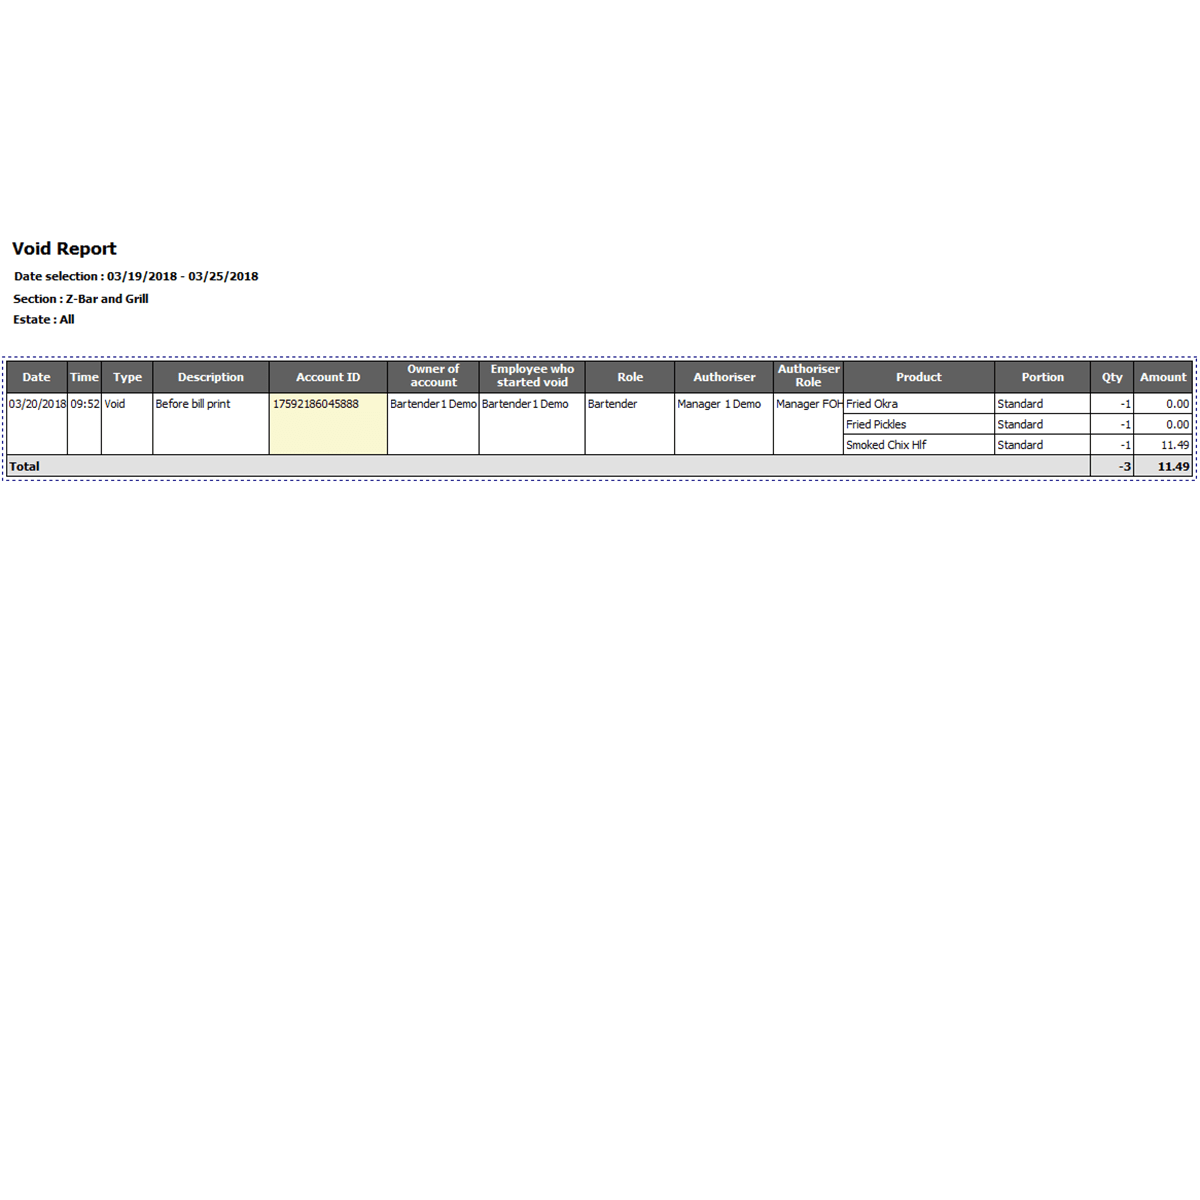
Void Report
Explore all voids made including authorization information, voided products with receipt lookup functionality.
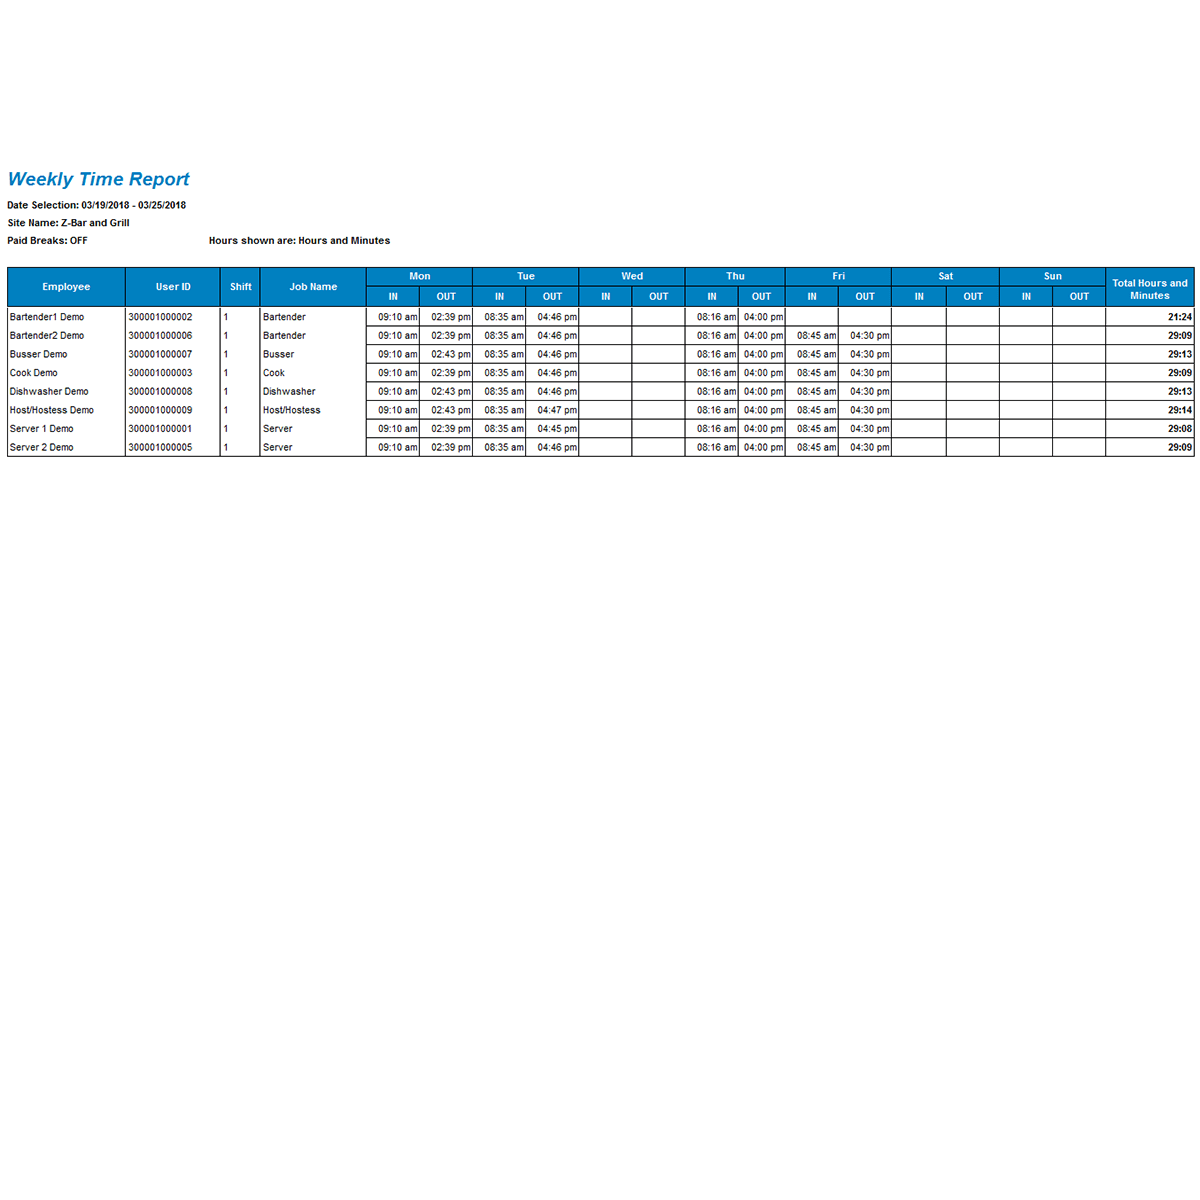
Weekly Time Report
Observe all employees clock in, clock out and job name for all shifts worked during a week.
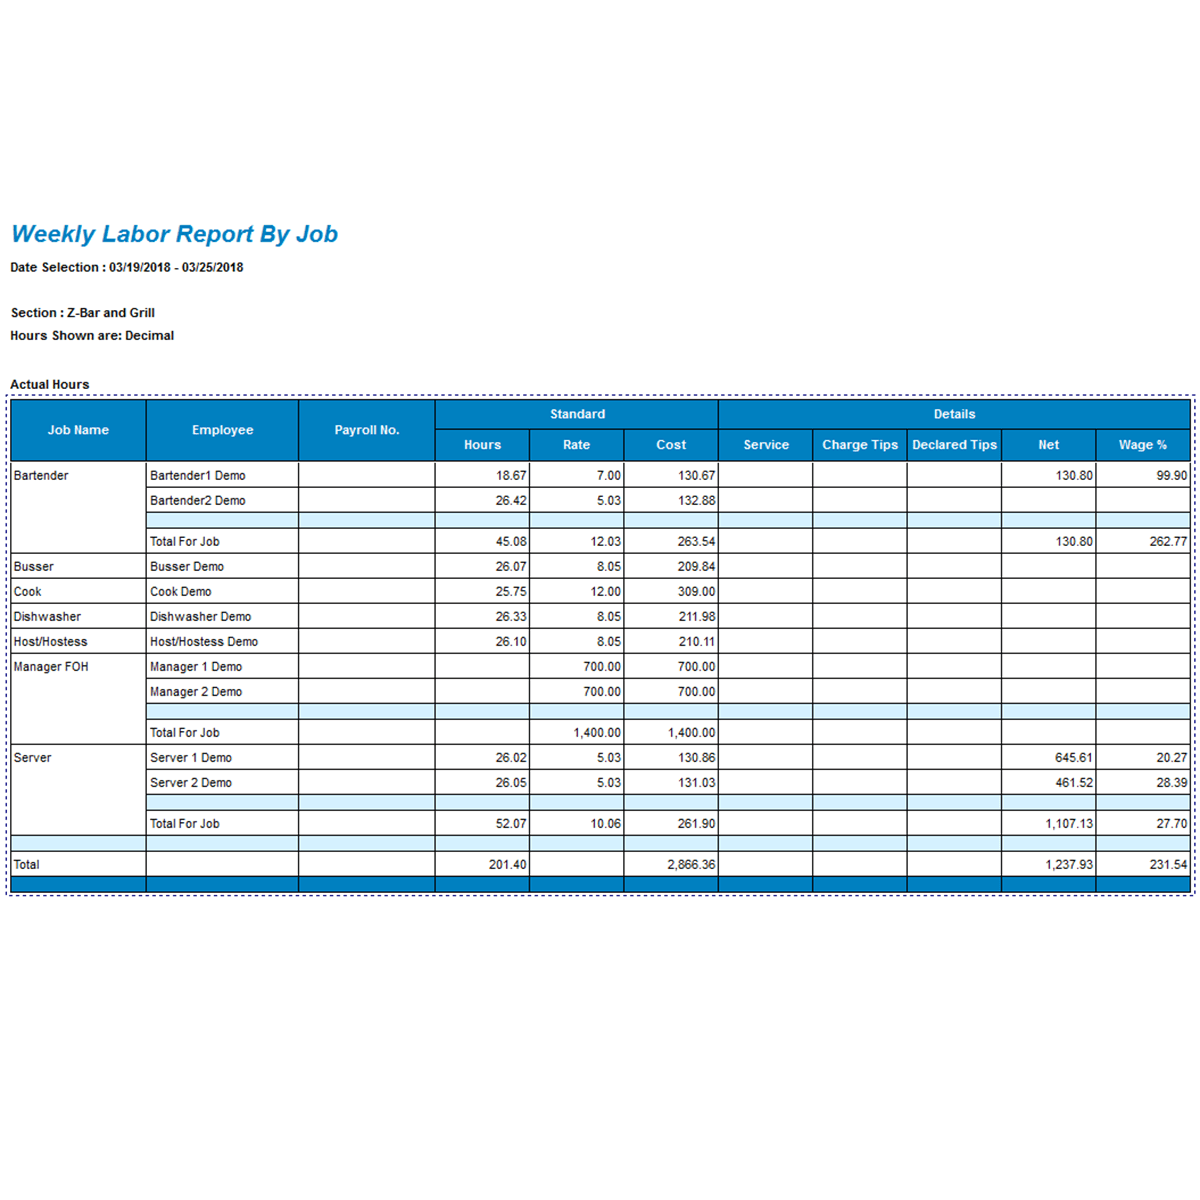
Weekly Labor Report by Job
Employees grouped by job worked showing hours worked, pay rate, employee cost, tip information, net sales and a wage percentage compared to their sales.
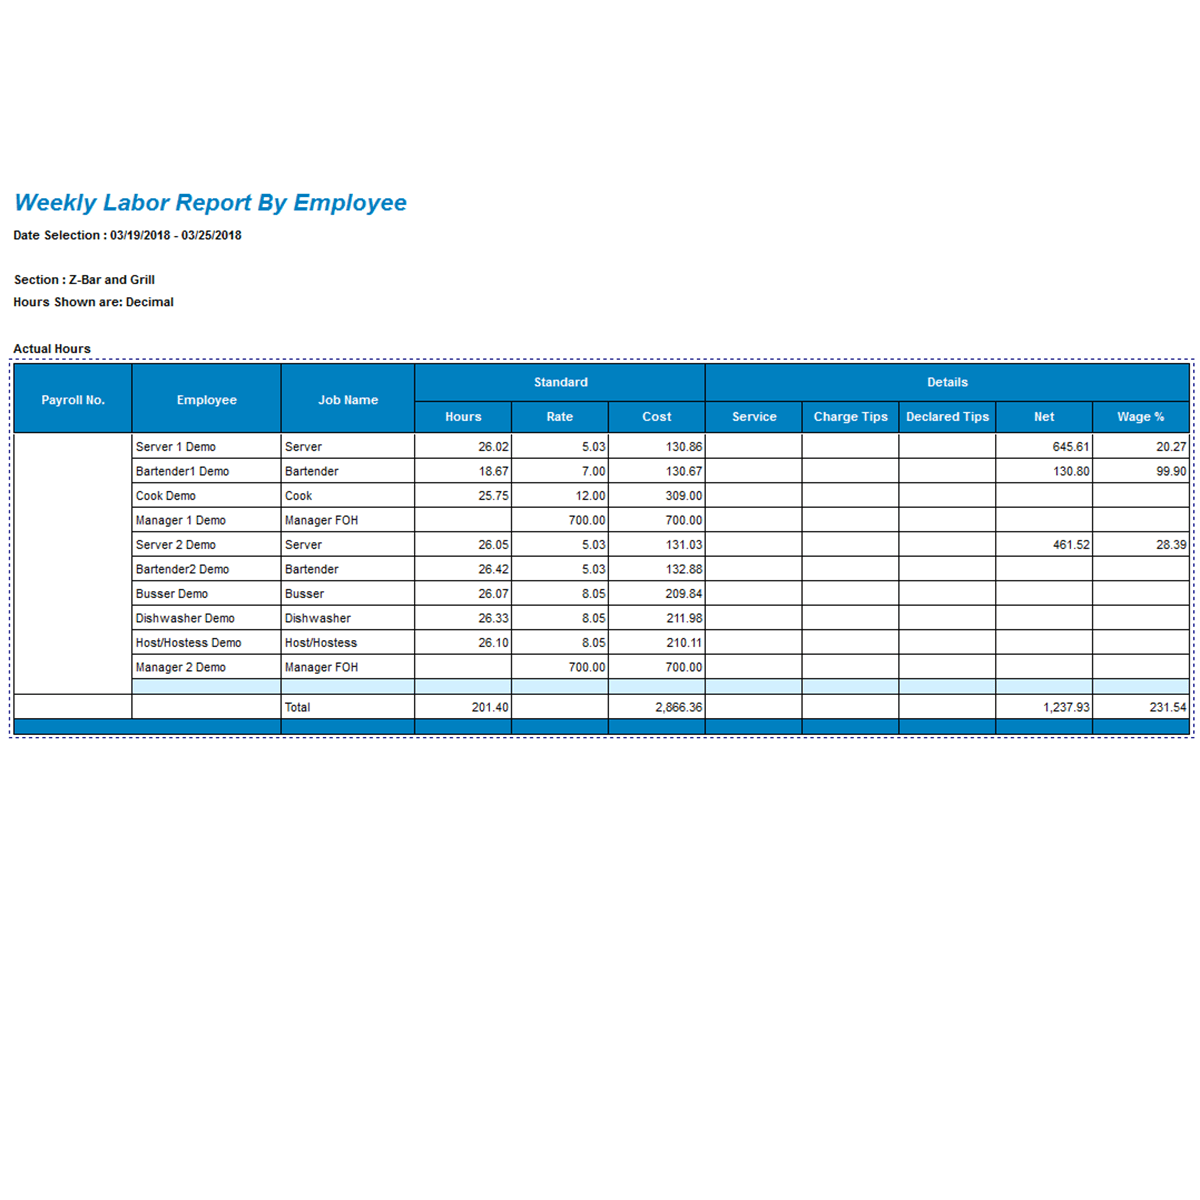
Weekly Labor Report by Employee
Employees sorted by employee name showing job worked, hours worked, pay rate, employee cost, tip information, net sales and a wage percentage compared to their sales.
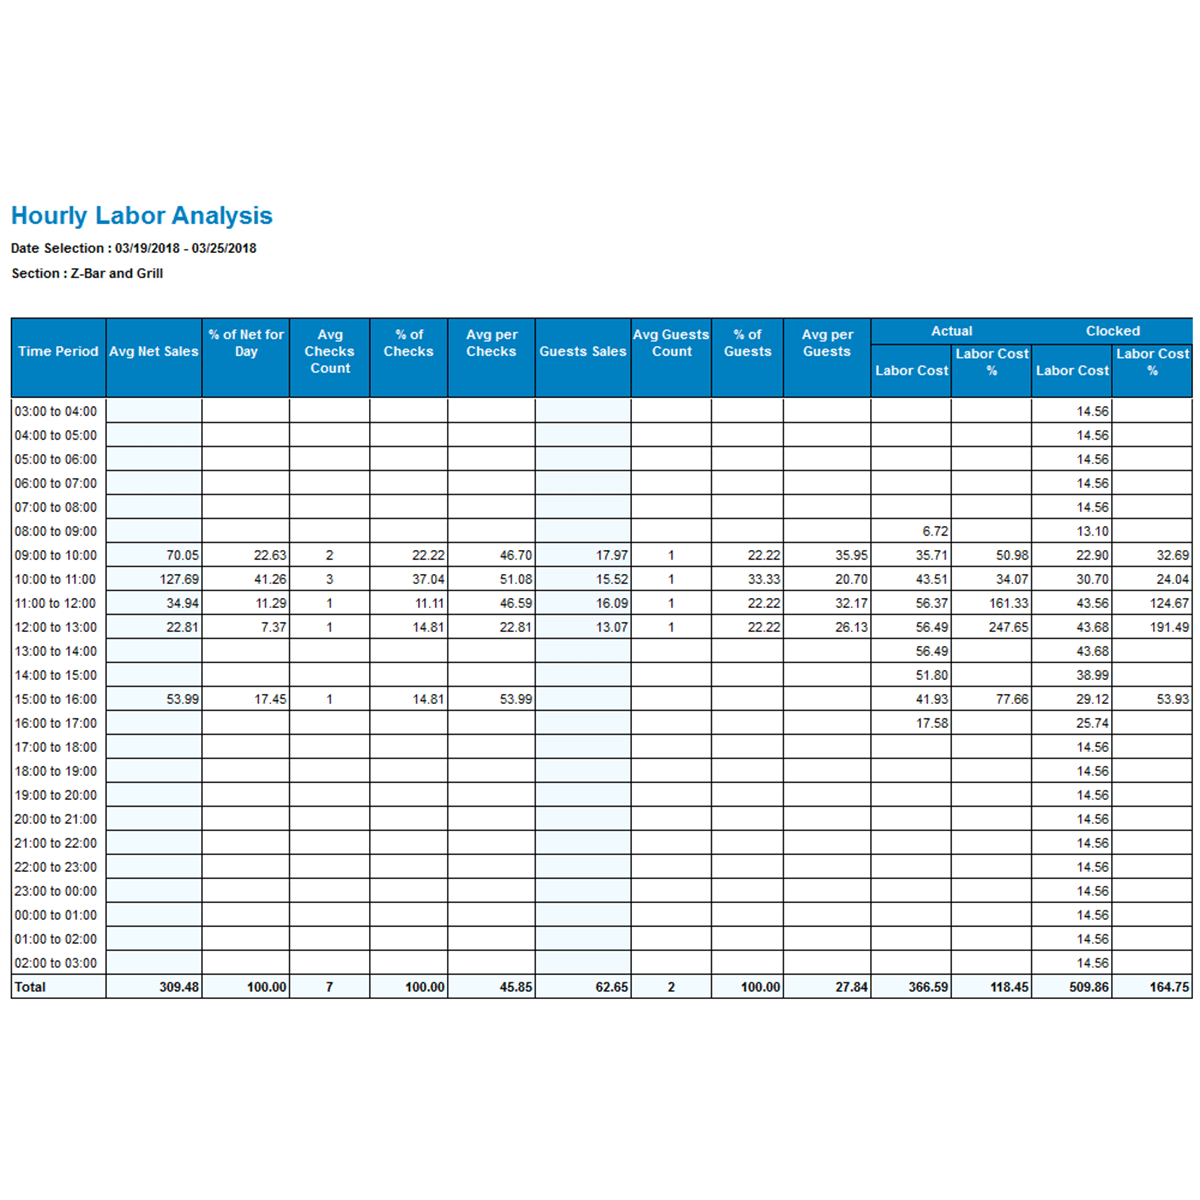
Hourly Labor Analysis
Examine labor cost by hour including net sales, number of checks, number of guests and averages.
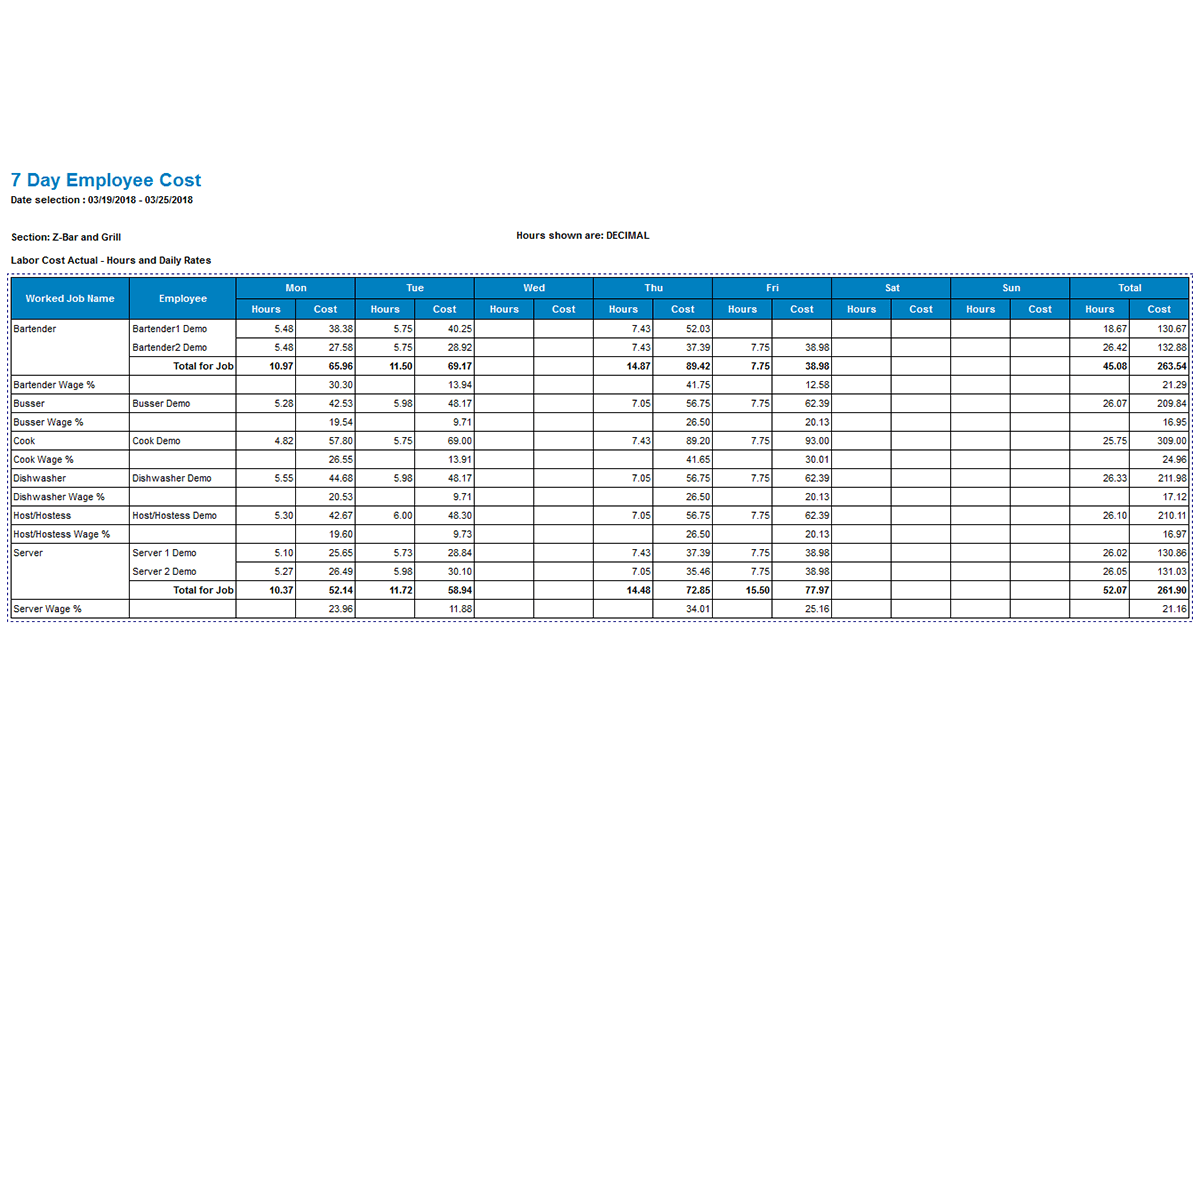
7 Day Employee Cost
Employees grouped by job and listed by day including hours worked and employee cost as well as totals for the week and each job.
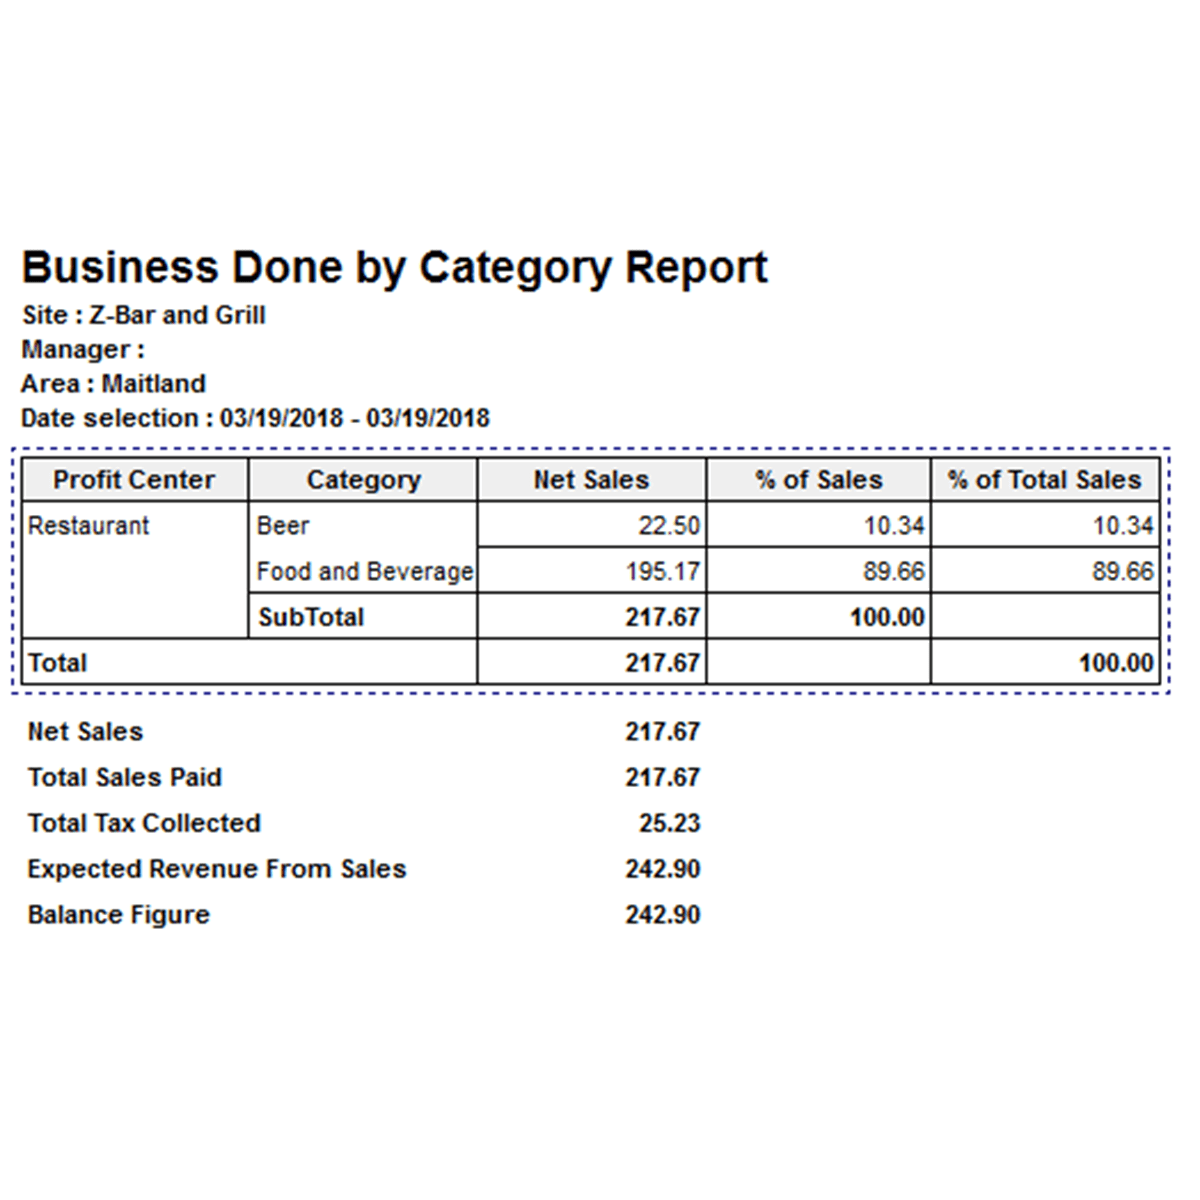
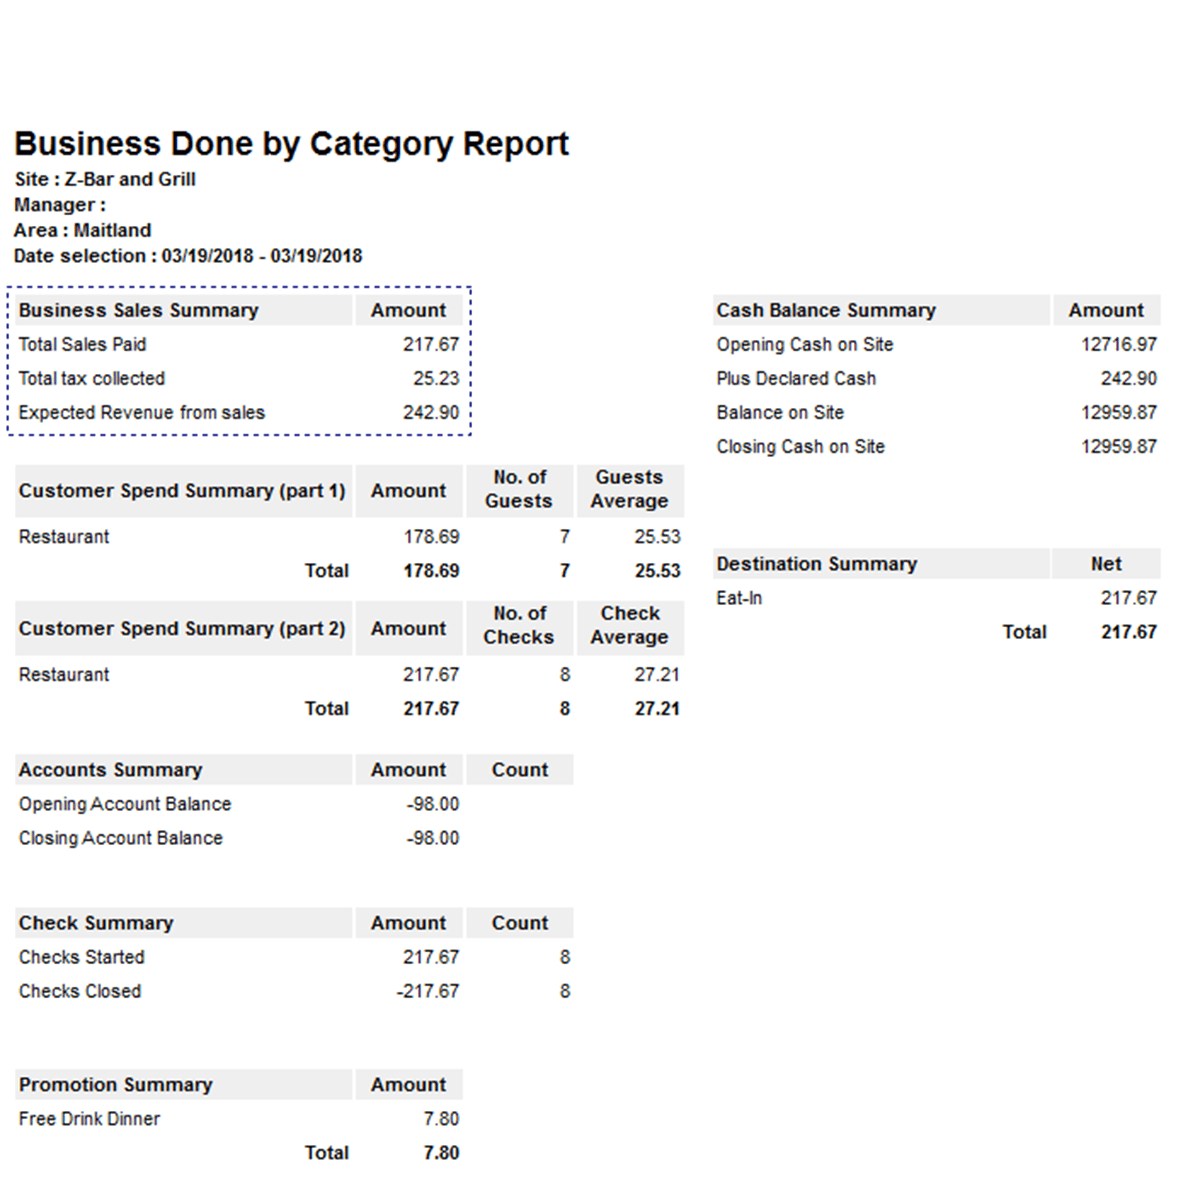
Sales Summary
View sales and percentages by category as well as total tax collected and expected revenue.
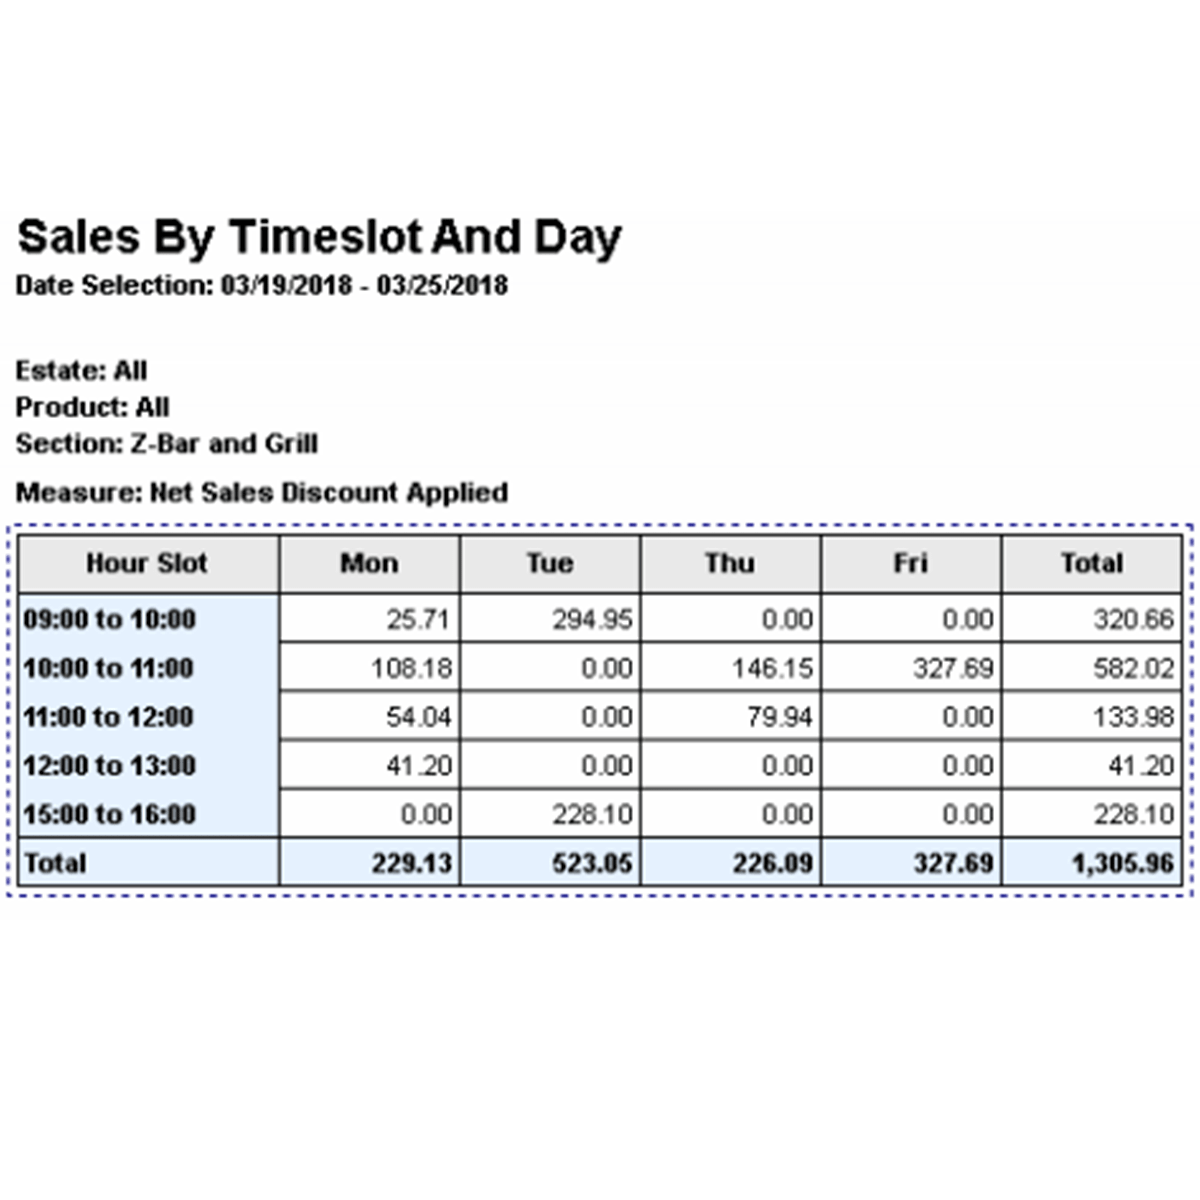
Sales by Timeslot and Day
Analyze sales by hour by day for any week, also available in half-hour increments.
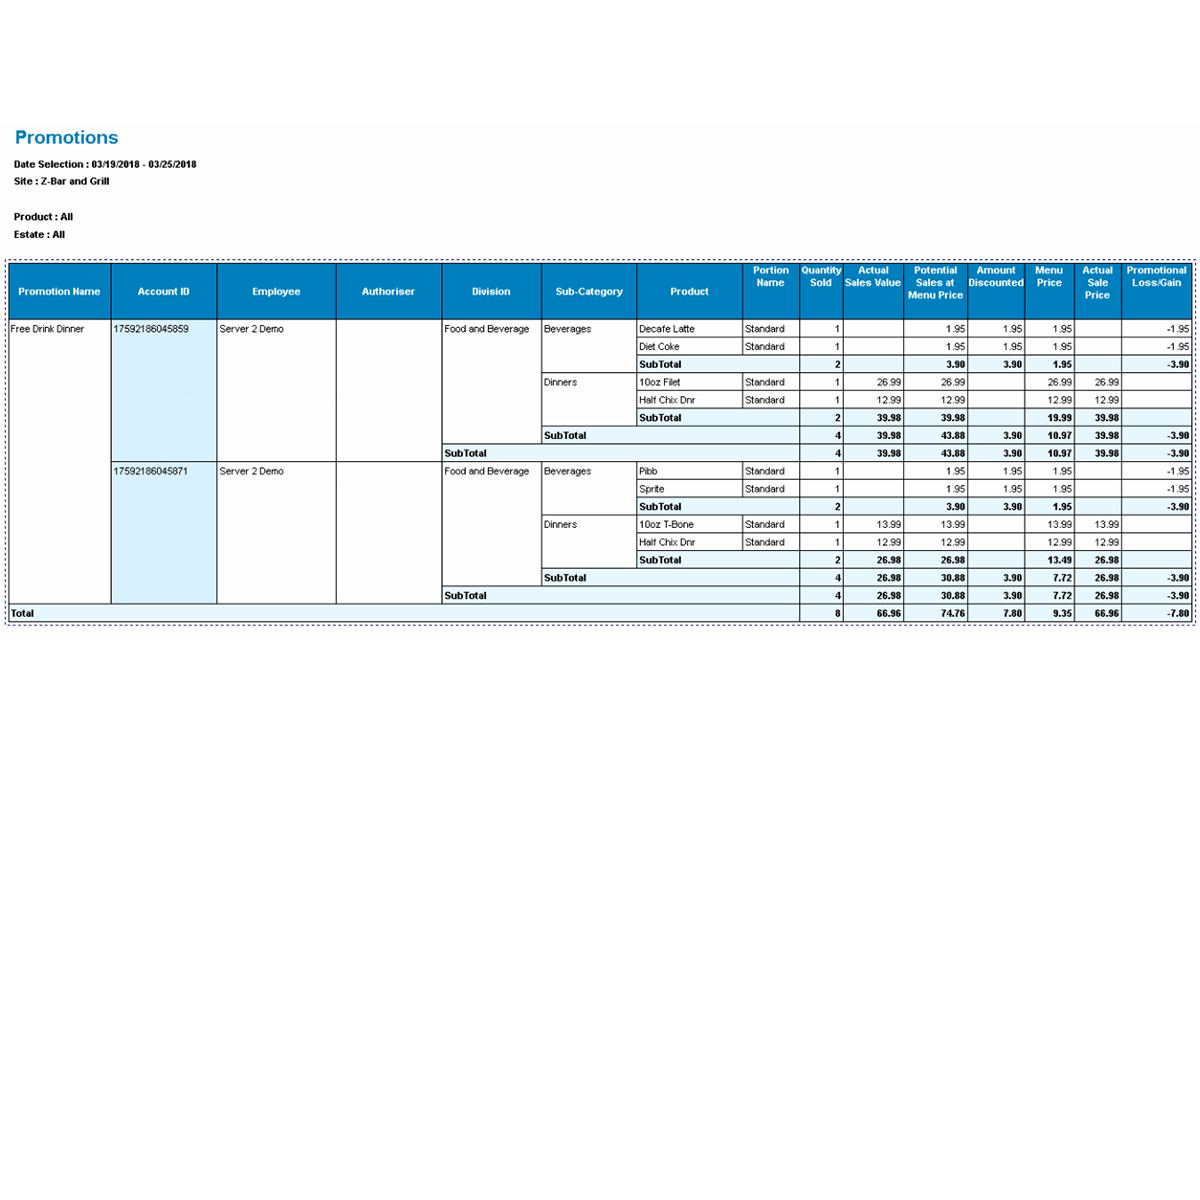
Promotions
Report showing promotional loss or gain by product with receipt lookup functionality.
Audit Transaction with Void
Report example highlighting a voided item showing authorization information and amount of void.
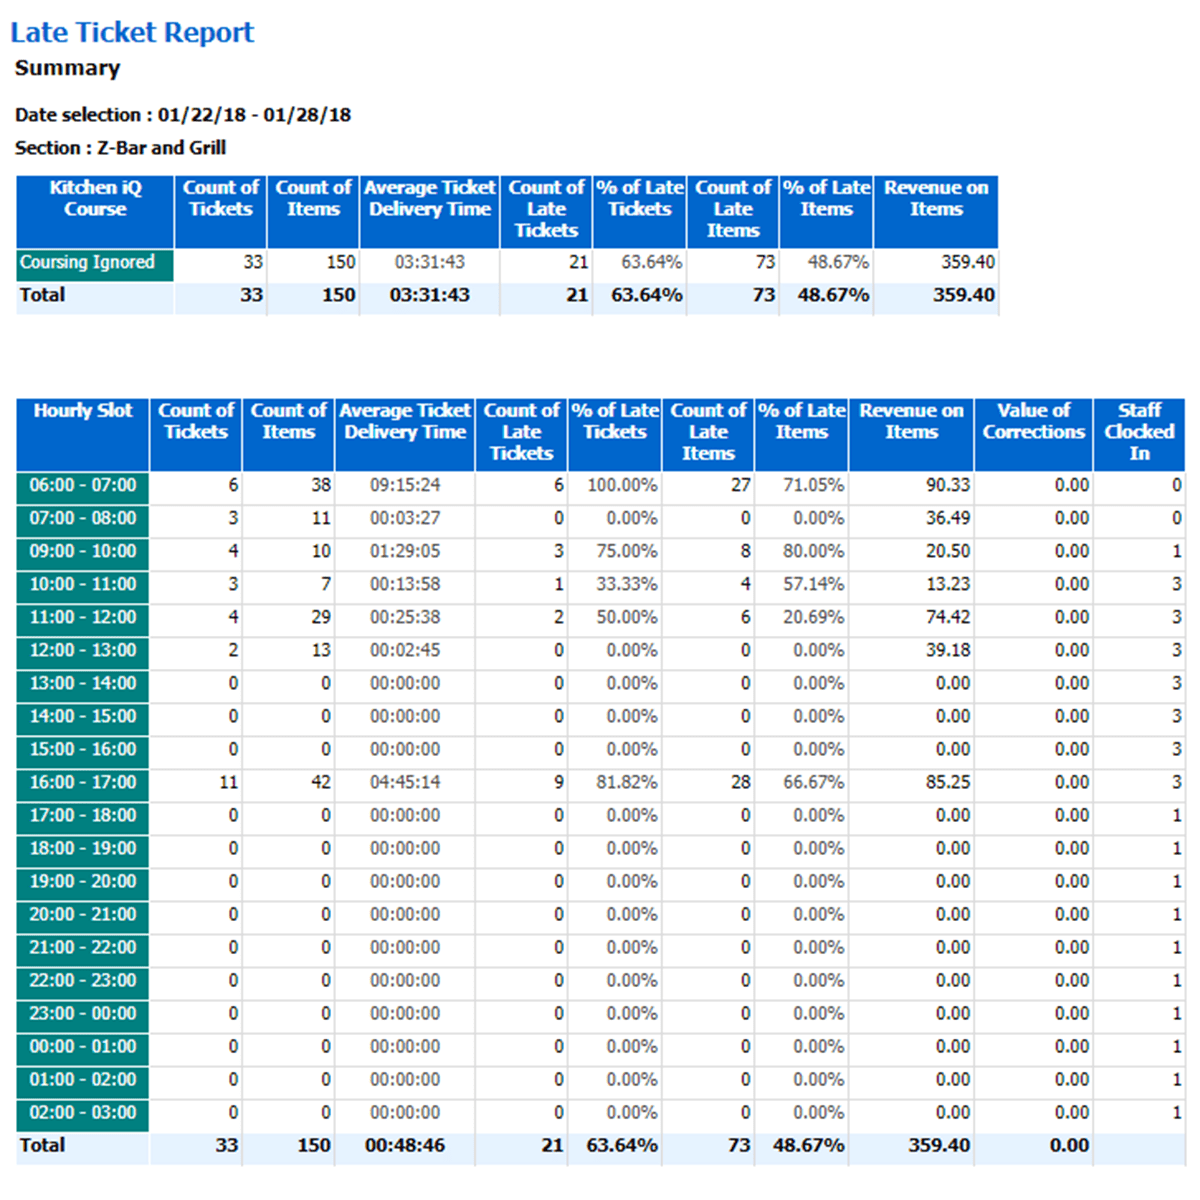
Kitchen IQ- Late Ticket Report
Reporting showing number of tickets and items by hour including number of late tickets, late items and number of staff clocked in per hour.
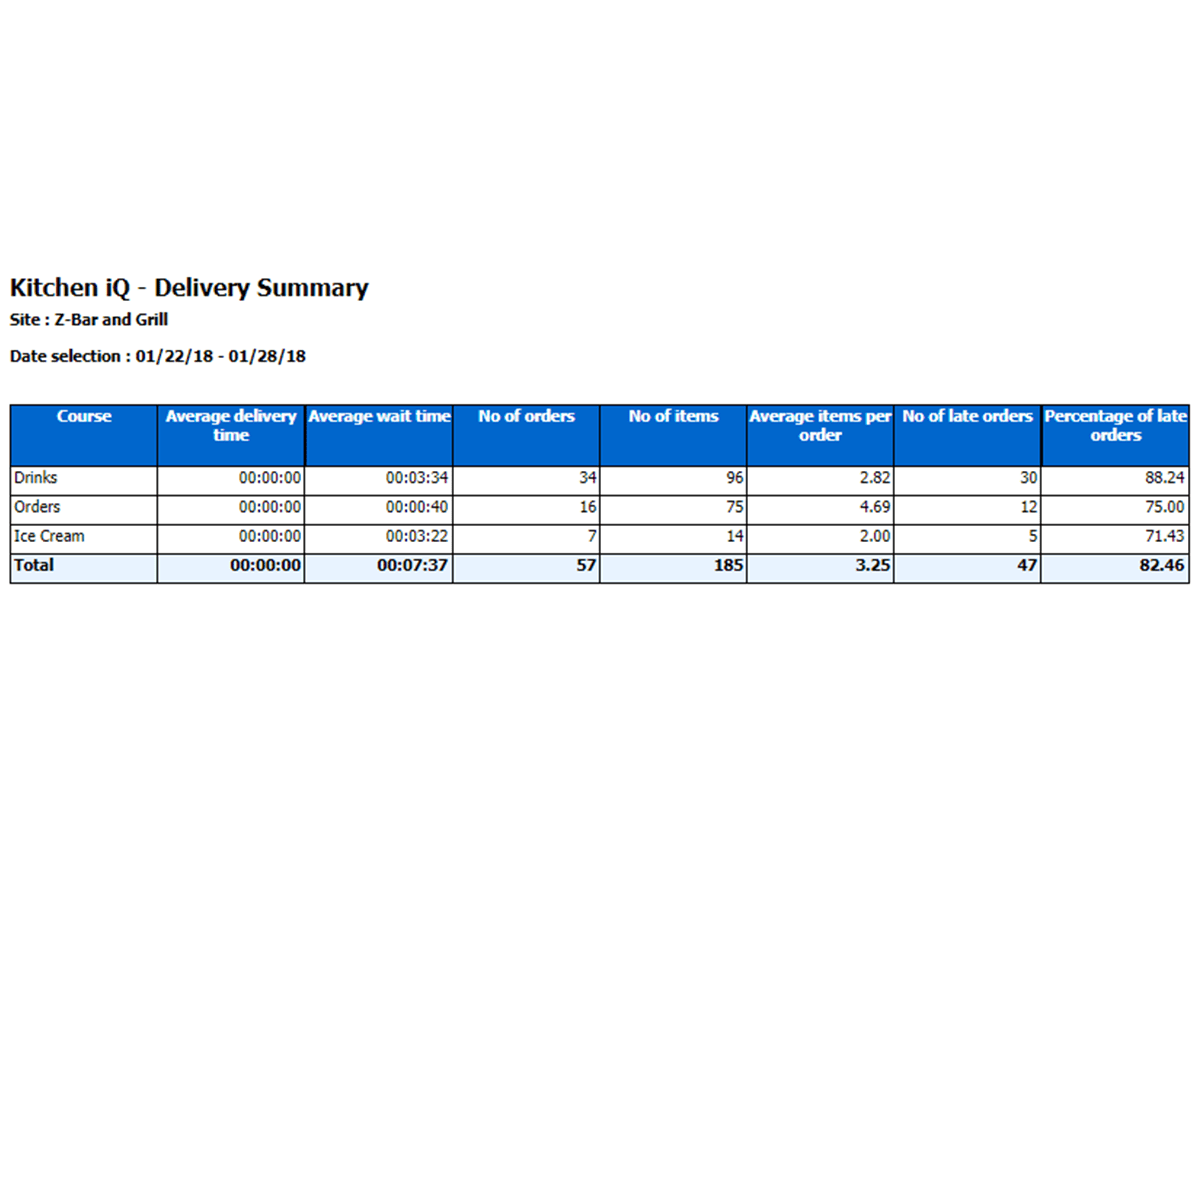
Kitchen IQ- Delivery Summary
Summary of delivery times, wait times and orders grouped by course.
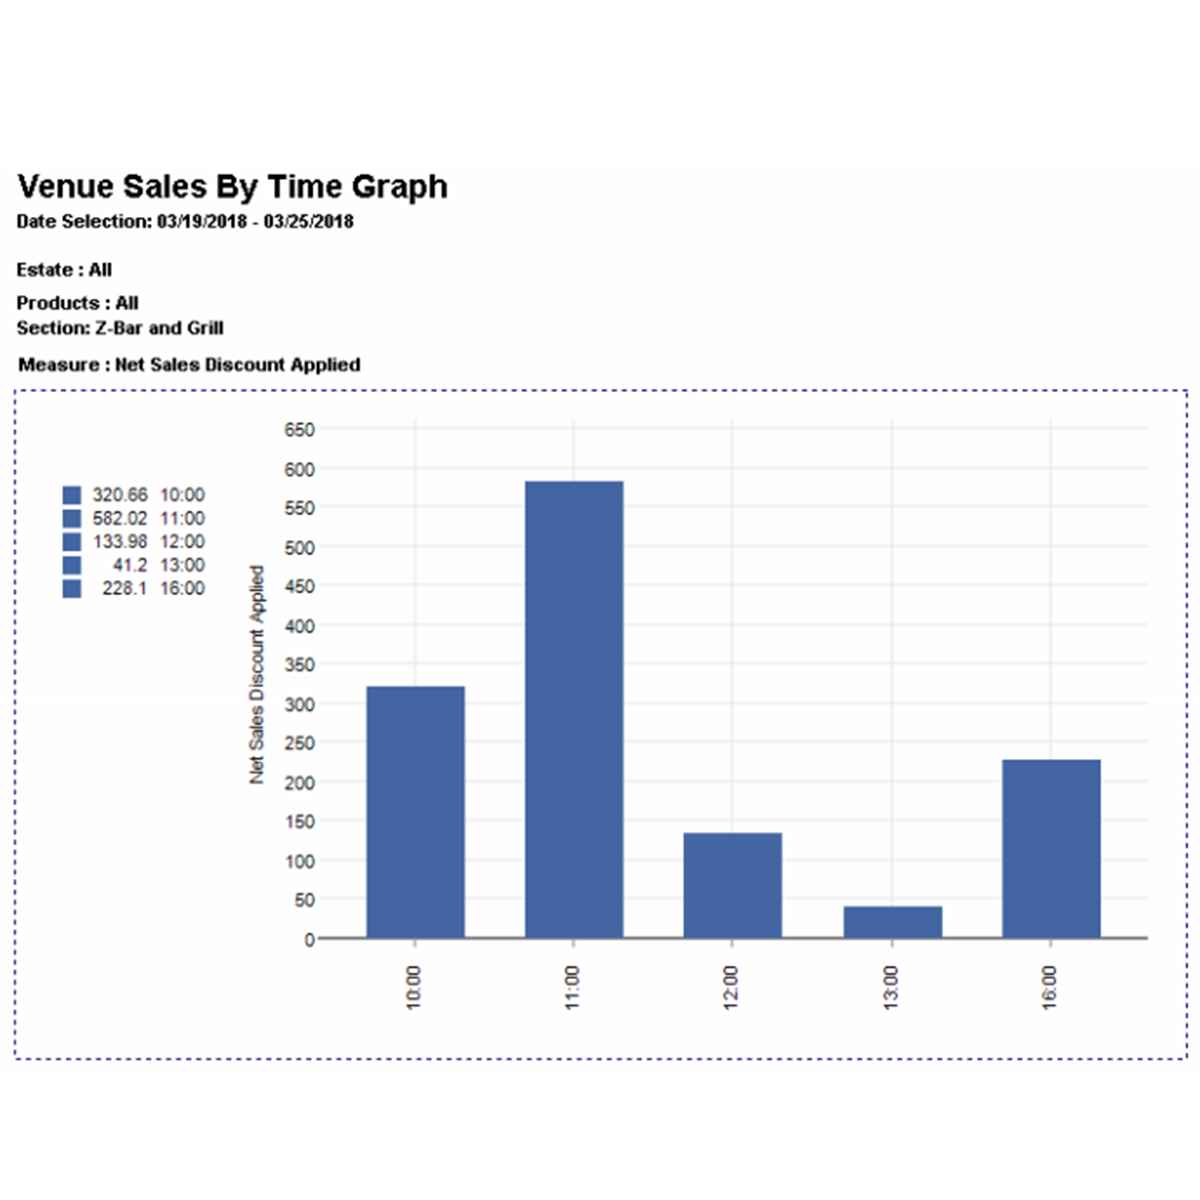
Venue Sales by Time Graph
Graphical view of net or gross sales by hour that can be run for any period of time you specify including day, week, month and year.